When you run ViewX, the window typically contains the following components:
The figure below is interactive. You can select different parts of the figure in order to access further information about your selection.
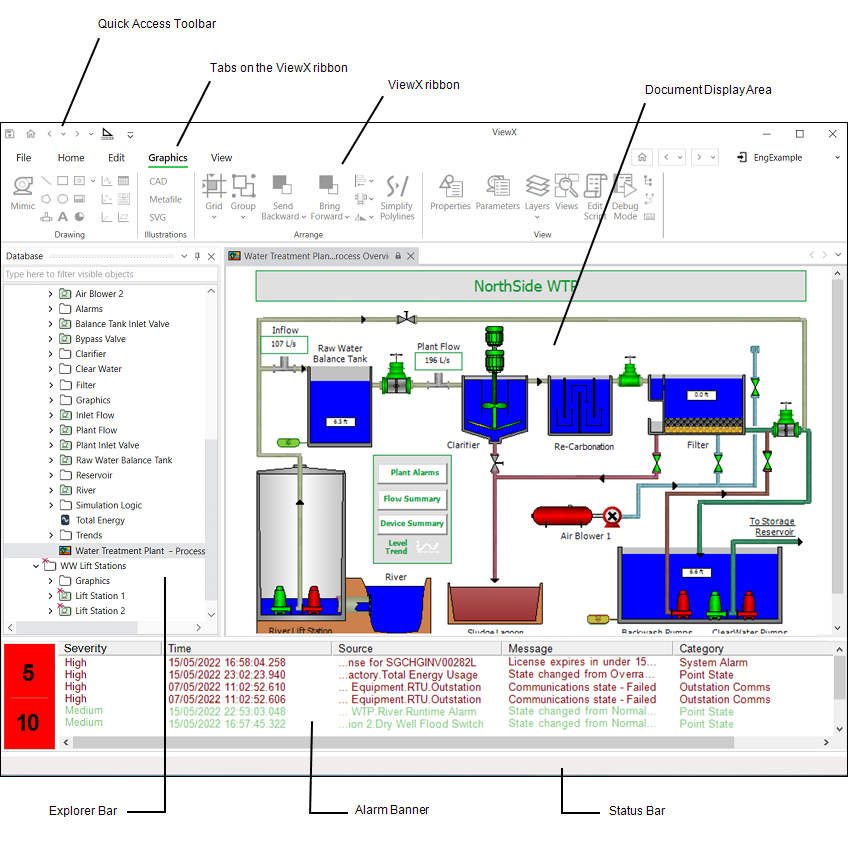
The Alarm Banner informs you about any existing or recent alarms on the system.
The Alarm Banner is hidden by default on a Virtual ViewX client (providing that your User Account enables you to
You navigate the system using the ViewX ribbon and Explorer Bar. You view the displays you require in the document display area. The Status Bar provides information on the status of the system and user activity.
For more information on these components, see the topics that are listed in the gray footer section at the bottom of this topic. Select the relevant entry to display the topic that you require.