Configure Power Quality Performance for multiple sites
To use the reports, diagrams, and dashboard gadgets for multiple sites, the module must be configured. The measurement data must be available as historical data logs in the database. To configure, follow the steps:
-
Create multiple sites and assign the devices for the created sites. See Creating a hierarchy for information on site creation and assigning devices.
-
Add a user group for the created sites and assign devices to user group. See Adding a user group for information on adding a user group and assigning devices to user group.
-
Perform the configuration of Power Quality Performance. See Configure Power Quality Performance for configuration steps. Additionally, you need to perform the following specific configuration:
Configure Power Quality Reports and Gadgets for multiple sites
You need to configure power quality group with the associated user group (which is created for the sites) to enable the power quality reports and gadgets to display as per the selected sites. See Power Quality Group definition for more information on power quality group definition.
-
Locate the
PowerQualityGroups.csvfile which is located under the folder:{root install folder}\Applications\PowerQuality\. -
Edit the file in Excel, Notepad or other text editor. If you are using Excel, for each power quality group, specify the associated user group name in column F. See Edit PowerQualityGroup.csv to follow the editing steps and example on different power quality group.
-
Repeat step 2 for each power quality group.
-
Save the file and keep the format as .csv.
-
Import the power quality group definition file. See Import / Export Power Quality Group Definition for information regarding importing the definition file.
Configure Power Quality Indicator diagrams for multiple sites
To configure diagrams for multiple sites:
Create VIP service for sites
NOTE: It is recommended that VIPs created for Power Quality Performance analytics must be used for Power Quality Performance analytics and must not be programmed for other data processing tasks.
You need to create VIP service for each of the created sites.
- Open a Command Prompt window.
- Change the current folder to
...\Power Monitoring Expert\system\bin. - Type
vip -Service -"N<custom name>"on the command line.This creates a VIP service with the name <custom name>. For example: if the custom name is Production, then created VIP service name is NVIP.Production.
- Open the Windows Services panel.
- Start the newly created VIP service.
- Repeat steps 1 to 5 for creating VIP service for other sites.
Create framework for sites
The default power quality framework is designed to process all devices information in a PME system. For multiple site, each VIP is for a specific site and the framework must be configured to include only the sources assigned to the site.
-
Create a copy of the PQPerformance folder available in .
{root install folder}\config\fmwk\. -
Rename the copied folder to identify for which site the folder is created. For example: Rename to PQPerformance-Production for the Production site.
-
Open the PQPerformance-Production folder to view the PQPerformance.fwn file.
By default, the framework request analytics for the entire system via URLs similar to
http://localhost/WebServices/PowerQuality/Analytics.svc/2015-07/Frequency?StartDaysAgo=30. To configure the specific site, the node path query string parameter must be appended to these URLs.The node path query contains two segments. The first segment identifies the view of the hierarchy and the second segment identifies the node that represents the site.
For example, in the following tree view,
Physical Layoutis the view of the hierarchy andProductionis the node that represents the site. So, the node path isPhysical Layout/Production.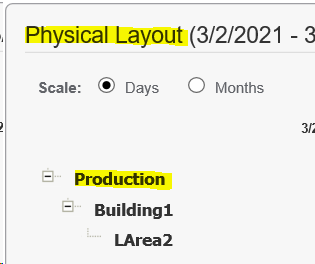
Based on the above example, the updated URL with node path is
http://localhost/WebServices/PowerQuality/Analytics.svc/2015-07/Frequency?StartDaysAgo=30&nodePaths=Physical%20Layout/Production -
Find and update all URLs in the PQPerformance.fwn file using the following regular expression:
NOTE: Use a find and replace tool to perform the update to the XML files rather than manually performing the changes. The recommended tool is Notepad++ find and replace utility in regular expression mode.
Find:
(http:\/\/localhost\/WebServices\/PowerQuality\/Analytics\.svc\/2015-07\/.*=\d{1,3})Replace:
\1&nodePaths=<site specific node path here>. For example,\1&nodePaths=Physical%20Layout/ProductionNOTE: Ensure the special encoding for the ampersand (
&) and use%20for spaces if they exist in the node path. -
Lock paste the created framework in Designer. See Paste the Power Quality Performance Framework for information on pasting the framework.
- Repeat steps 1 to 5 for creating framework for other sites.
Create Vista Diagrams for sites
The default diagram is designed to show all devices information in a PME system. For multiple sites, each diagram is for a specific site and the diagram must be configured to include only those sources assigned to the site.
-
Create a copy of the PQPerformance folder available in .
{root install folder}\config\diagrams\ud\. -
Rename the copied folder to identify for which site the folder is created. For example: Rename to PQPerformance-Production for the Production site.
-
Find and replace all VIP reference in the folder using the following regular expression:
NOTE: Use a find and replace tool to perform the update to the XML files rather than manually performing the changes. The recommended tool is Notepad++ find and replace utility in regular expression mode.
Find:
VIP.PQADVISORReplace:
VIP.<node name>. For example,VIP.Production -
Find and replace all links between the diagrams in the folder using the following regular expression:
NOTE: Use a find and replace tool to perform the update to the XML files rather than manually performing the changes. The recommended tool is Notepad++ find and replace utility in regular expression mode.
Find:
(xlink:href="x-pml:\/diagrams\/ud\/PQPerformance)Replace:
\1-<node name>. For example,\1-Production -
Open the Power Quality Indicator Diagrams. See Open the Power Quality Indicator Diagrams for information on opening the diagrams.
- Repeat steps 1 to 5 for creating diagrams for other sites.
Update log viewer query functions for sites
The default log viewer query functions are designed to query all devices information in a PME system. For multiple sites, each log viewer query function is for a specific site and the query must be configured accordingly.
-
Find and replace all functional calls between the diagrams in the newly created folder for a site using the following regular expression:
NOTE: Use a find and replace tool to perform the update to the XML files rather than manually performing the changes. The recommended tool is Notepad++ find and replace utility in regular expression mode.
Find:
(udfPQ_List.*)(\) -- Do)Replace:
\1,'<node path>'\2. For example,\1,'Physical Layout/Production'\2 -
Repeat step 1 for creating log viewer query functions for other sites.
(Optional) Update diagram captions for sites
The default diagram caption is Power Quality Performance. For each site created, this caption can be changed so it can be uniquely identified.
-
Find and replace all instances of the default diagram caption in the newly created folder for a site using the following regular expression:
NOTE: Use a find and replace tool to perform the update to the XML files rather than manually performing the changes. The recommended tool is Notepad++ find and replace utility in regular expression mode.
Find:
(caption_position="0">)Power Quality Performance(.*<FontSpec)Replace:
\1<node name>2. For example,\1Production\2 -
Repeat step 1 for creating diagram captions for other sites.