The insulation monitoring diagrams display overview or detail information as well as status.
Facility Summary diagram
The Facility Summary diagram shows each group that contains a number of areas.
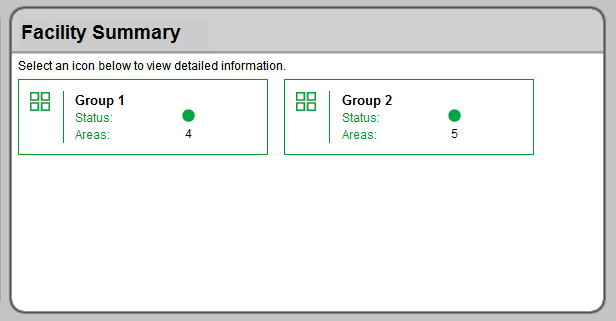
The Facilities Summary diagram shows all the groups of areas that were configured for the facility. Each box in the main area represents a group of areas. This diagram provides a status overview and links to areas in the facility, as shown next:

|
A |
Group Icon – Click the group icon to see the area diagram. |
|
B |
Status Indicator – This indicator is green or red to show the general status of the isolated power system:
|
|
C |
Areas Total number of monitored areas in this facility. |
Recommended Actions for Alarm Condition Indication
- Click the Group icon to open the Areas diagram. One or more area boxes will show an alarm condition.
- Click the specific area icons to open the Area Details diagrams. One or more panel boxes will show an alarm condition. If the optional circuit fault locator devices are installed, the panel box also indicates each circuit that has a resistance fault.
NOTE: Some types of electrical faults can occur and not be indicated by the individual circuit fault locators. Only the area status indicator turns red. See Indicators for capacitive faults for details.
- Notify the responsible person that can address the condition for the area and specific circuits.
Summary of Areas diagram
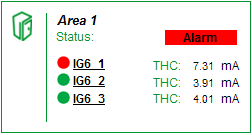
The Summary of Areas diagram shows an overview of each area in the facility. Each box represents a single area.
Example:
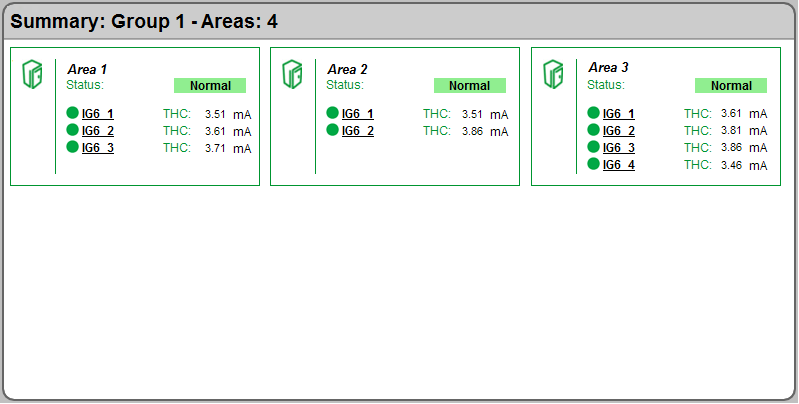
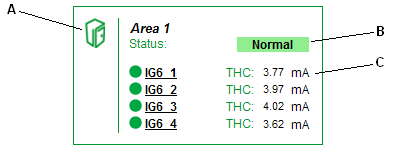
Each box represents a single area and contains the following information:
|
A |
Area Icon – Click the area icon to see LIM-IG6 and circuit details for the area. |
|
B |
Area Status Indicator – Indicates the general conditions of the area. This indicator is either green "Normal" or red "Alarm". If the indicator is red, one or more IG6 monitors are in test mode or the Total Hazard Current measurement exceeds the limit. |
|
C |
LIM-IG6 Status and Current Indicators – Displays the insulation status and real-time Total Hazard Current, in mA, for each LIM-IG6 in the area. Up to six LIM-IG6 monitors can be installed in an area. The indicator changes to red if the LIM-IG6 is in test mode or if a THC measurement exceeds the limit. When in test mode, the THC measurement changes to 10.0 mA and the red "Testing" label appears next to the LIM-IG6 name. The test lasts 5 to 30 seconds. When the test is complete, the color changes to green. If a LIM-IG6 detects an insulation alarm, the THC measurement shows the real-time THC value. |
LIM-IG6 in test mode:
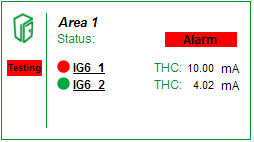
LIM-IG6 in alarm condition:
Area Details diagram
The Area Details diagram shows the details for each LIM-IG6 and connected devices in an area. The Area Details diagram can show up to 3 LIM-IG6 monitors. If more than 3 monitors are in the diagram, click the arrow in the upper right corner to see other monitors.
NOTE: For 208/240V systems, one LIM-IG6 can be shared between 2 areas. In this case, the monitor appears on both area diagrams.
For example, the following image shows a diagram of the area and LIM-IG6 details:
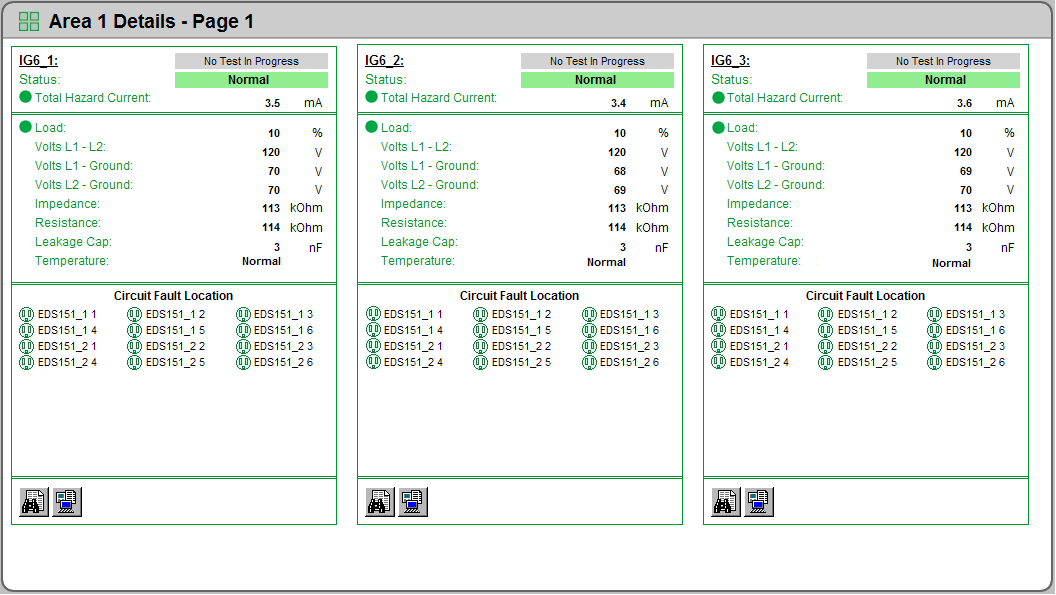
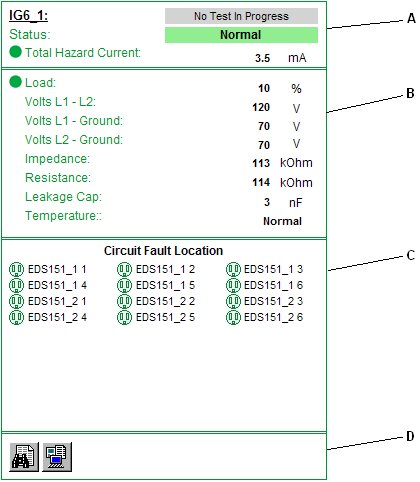
Each LIM-IG6 area contains these sections to provide specific information about the circuit conditions:
|
A |
LIM-IG6 Status – Displays the name and status of the monitor, real-time THC measurement, and test status. The THC measurement is taken directly from the LIM-IG6. This indicator is either green "Normal" or red "Alarm". If the indicator is red, one or more panels are in test mode or circuits in the area have THC measurements above the limit. The red "Test In Progress" label appears when someone starts a LIM-IG6 test. A test is started by pressing the test button on the LIM-IG6 or by pressing the test button on the remote test device. This label remains visible during the test. See Indicators for Test Mode and Alarm condition for details. |
|
B |
Measurements – Displays the real-time measurements for the components connected to the LIM-IG6.
|
|
C |
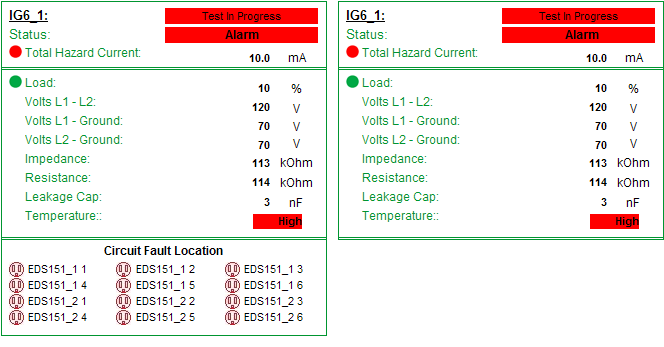
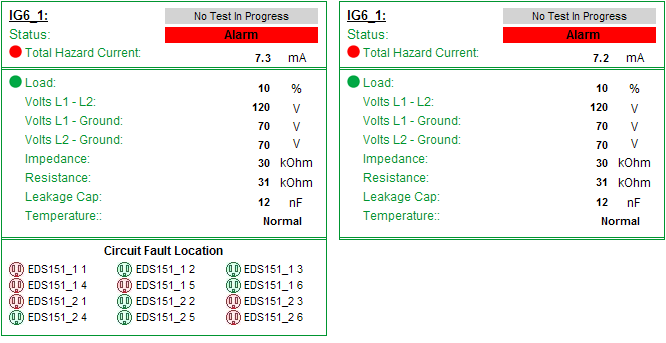
Circuit Status – Appears only if the optional circuit fault locator is connected to the LIM-IG6. This area shows the status for each circuit being monitored. If the LIM-IG6 detects a resistance fault, the circuit monitor identifies the specific circuit and the circuit indicator turns red. When any indicator turns red, the alarm status propagates up to the top-level Facility Summary diagram. If the LIM-IG6 is in test mode, all circuit indicators turn red. See examples below for indicators in test or alarm condition.
|
|
D |
Event Log and Data Log – Contains links to the historical data log and event log for the panel measurements. See Data logs for more information. |
Indicators for Test Mode and Alarm condition
LIM-IG6 in test mode, with circuit fault locators (left) and without circuit fault locators (right):
LIM-IG6 in alarm condition, with circuit fault locators (left) and without circuit fault locators (right):
Indicators for capacitive faults

 danger
equipment electric shock, explosion, or arc flash
| ● | Do not ignore the main device hazard indicator when all circuit fault locator icons show green status. |
| ● | Determine and correct the cause of the fault if the main device hazard indicator shows a hazard. |
Failure to follow these instructions will result in death or serious injury.
In some cases, such as when too many equipment items are connected to circuits, the LIM-IG6 detects a capacitance fault that exceeds the total hazard current (THC). For this situation, the room Status area shows the hazard, as shown next. However, if the optional circuit fault locators are installed, the circuit indicators do not indicate the capacitive fault, because they show only resistance faults, as shown next:
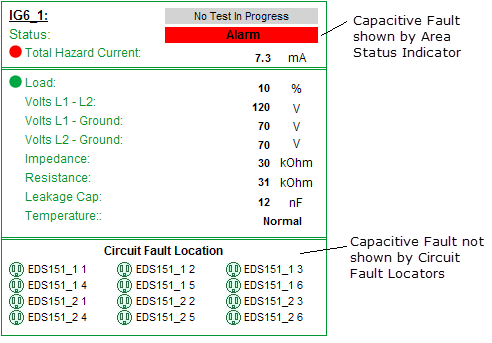
If all the circuit fault indicators are green, as above, and the room Status area shows a hazard, appropriate personnel must determine and correct the cause of the fault.
See the following topics:
- Using the diagrams
- Data logs
Different diagrams are provided for ANSI and IEC regulated applications:
Related topics:
- The Diagrams user interface
- User authentication
- Viewing historical (trend) data
- Viewing meter events
- Stale data and error indicators
- Power Quality Performance diagrams
- Insulation Monitoring diagrams
- UPS Auto Test diagrams
- EPSS diagrams
- Breaker Aging diagrams
For information on how to configure Diagrams, see Diagrams and graphics configuration.
