Configuration
Before configuring the Thermal Monitoring of LV Busways application, confirm that the Prerequisites are in place for your system.
Configuring this application requires the following steps:
- Adding the Ethernet Gateway and ZBRN32 access point in Management Console or Device Manager.
NOTE: Each ZBRN32 access point needs a mid-range device license in PME.
- Setting up the temperature sources in Vista.
- Setting up temperature alarms.
- Setting up Dashboards, Diagrams, Trends, Alarms, and Reports for temperature data.
- (Optional) Setting up alarm views for temperature sensor communication alarms.
To add the Ethernet Gateway and ZBRN32 access point in Management Console:
- Open Management Console and log in with a supervisor-level user account.
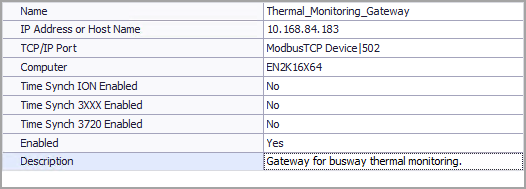
- Under Sites, add a new Ethernet Gateway Site.
Set the Name and IP Address for the gateway. For TCP/IP Port select ModbusTCP Device|502.
Example:
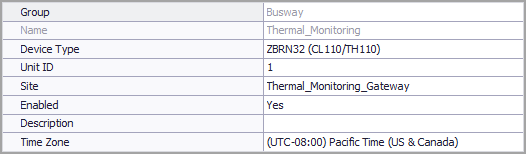
- Under Devices, add a new Serial Device on Ethernet Gateway Site.
Set the Group, Name, Unit ID, and Time Zone for the access point. For Device Type select ZBRN32 (CL110/TH110). For Site select the Ethernet Gateway Site added in step 2.
Example:
- Close Management Console
TIP: For information on how to set up sites and devices in Device Manager, see Device Manager.
To set up the temperature sources in Vista:
- Open Vista and log in with a supervisor-level user account.
- Generate a network diagram.
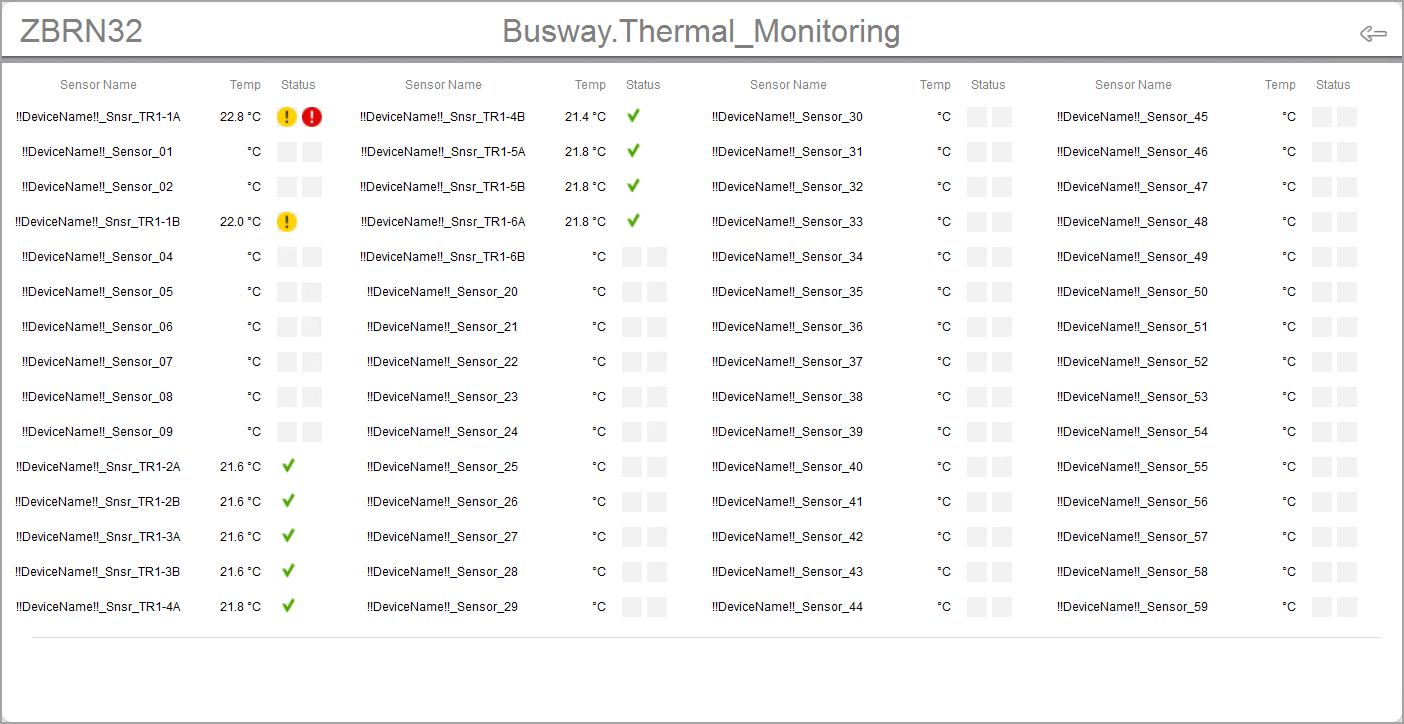
- Open the diagram for the ZBRN32 access point.
The diagram shows information for 60 possible temperature sensors. Only those sensors that are installed and connected to the ZBRN32 access point show a temperature measurement.
Example:
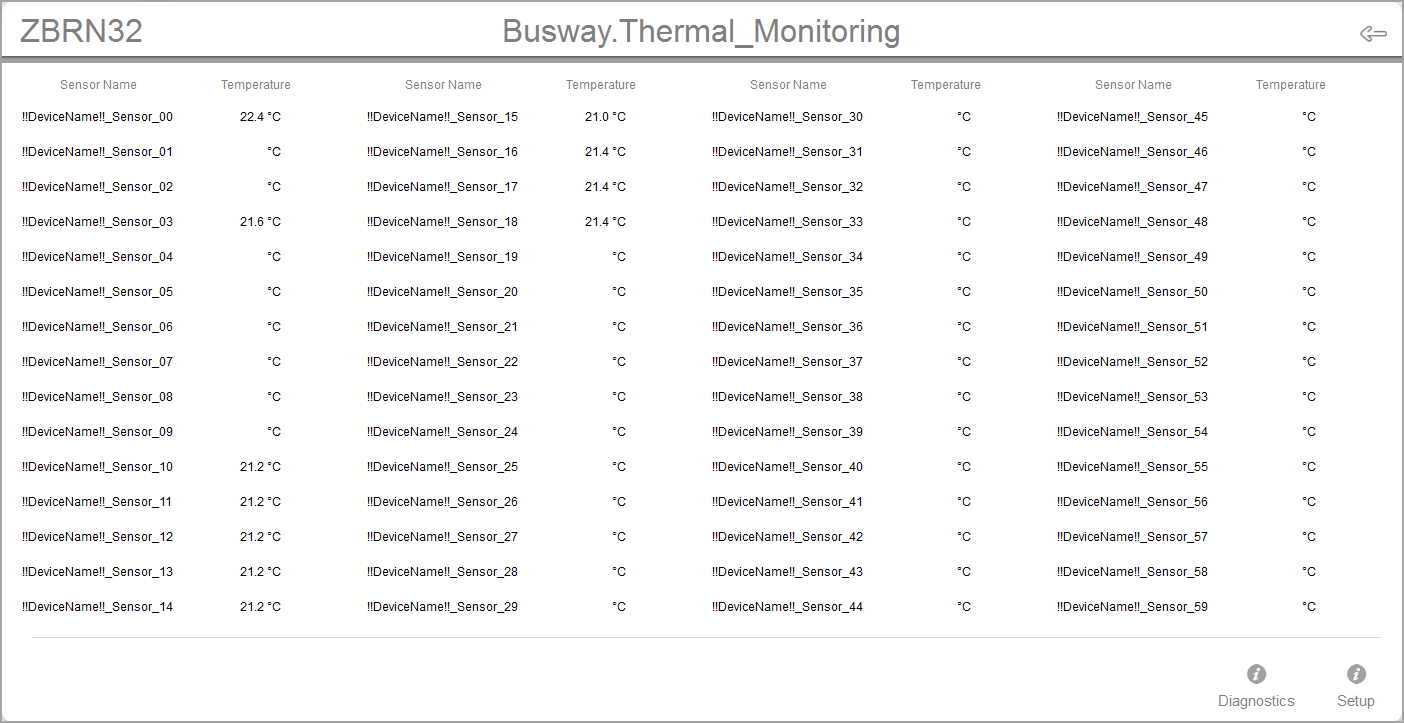
- Select Setup in the lower right-hand corner of the diagram to open Setup view.
- Select Options > Show Toolbox from the Vista menu, and then change the names of the installed sensors by double-selecting the name field, editing the default name, and then pressing Enter on your keyboard. See Selecting Sensor Names for tips on choosing a sensor name.
NOTE: Complete the sensor naming before moving to step 6. If you rename the sensors after enabling logging, this will affect the source names under which the data is logged.
- Enable the Log. The device driver for the ZBRN32 access point in PME will start logging temperature measurements for all installed and connected sensors on a 15 minute interval.
- Close the Vista diagram.
- Open Software Alarms in Web Applications > SETTINGS > Alarms.
- Add a new alarm rule for the thermal alarm, with the following details:
- Alarm Template: Select the Realtime Setpoint template under the All or Common category.
- Measurement: Select the Temperature (°C) measurement under the Environmental category.
- Priority: Select a priority that is appropriate for this alarm, for example High.
- Alarm Status Measurements: Turn on Enable Realtime Alarm Status Measurements.
Enter other alarm information as required. See Adding a new Alarm Rule for information on how to add alarm rules.
- Add a new alarm rule for a thermal pre-alarm. Use the same details as for the thermal alarm, but set the temperature thresholds lower so that the pre-alarm is activated before the main alarm.
Example of a thermal alarm and pre-alarm:
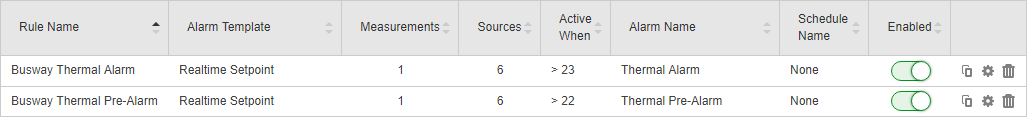
- Exit Software Alarms.
To set up Dashboards, Diagrams, Trends, Alarms, and Reports:
You can set up the Web Applications, or any other relevant data display or processing application to use the busway temperature data. Follow the standard workflow for configuring these applications. For details see:
- Dashboards configuration
- Diagrams and graphics configuration
- Trends configuration
- Alarms configuration
- Reports configuration
The ZBRN32 access point device driver includes a sample diagram for the display of temperature sensor real-time measurements and alarm status. You can use this diagram as a starting point for creating custom end-user diagrams. Find the diagram under ...\config\diagrams\ud\default\ZBRN32_CL110_TH110_V1.0.0\zbrn32_cl110_th110_v1.0.0_example.dgm.
TIP: Save your diagrams under ...\config\diagrams\ud or a sub-folder of ud but not in the ud\default folder. This makes it possible to add your diagram to the Diagrams Web application. The ud\default folder is not visible in Diagrams.
Below is an example of a partially customized diagram based on the diagram provided with the add-on device driver. The alarm status displays for each sensor have been linked to the pre-alarm and alarm status measurements.
(Optional) Setting up alarm views for temperature sensor communication alarms
The ZBRN32 access point device driver in PME monitors the temperature sensor communication status and generates alarms on communication interruptions. The alarms are categorized as Asset Monitoring > Thermal Monitor.
RECOMMENDATION: Configure an alarm view for Asset Monitoring > Thermal Monitor to track and monitor temperature sensor communication issues. See Alarms configuration for information on how to setup alarm views.
NOTE: The thermal monitoring data registers (temperature, humidity, and so on) display "NA" values when communication with the sensor is interrupted.