Data logs
When you need details about circuit measurements and details, the Area Details diagram provides links to the historical data log and the event log. These logs provide measurement data for the 15-minute polling interval of the Vigilohm IM20-H. You can filter the data in the logs by date range.
Historical data log
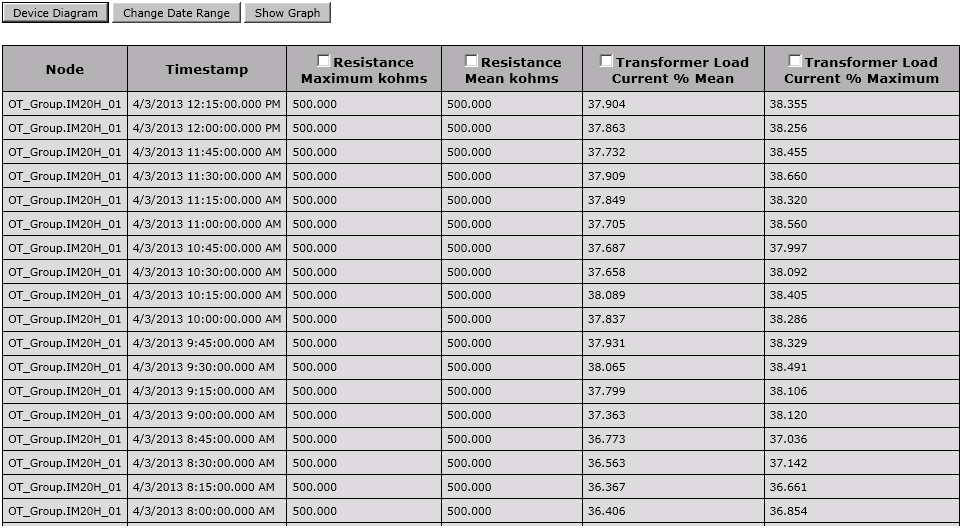
The following image shows the historical log table from the Power Monitoring Expert view:

The buttons located at the top of the table are:
- Device Diagram – Click this to return to the diagram.
- Change Date Range – Click this to view data for different dates. See "Select Date Range" below for more information.
- Show Graph – Select one or more column headers in the table and then click Show Graph to see a graph of the data. The graph shows the data at 5-minute intervals.
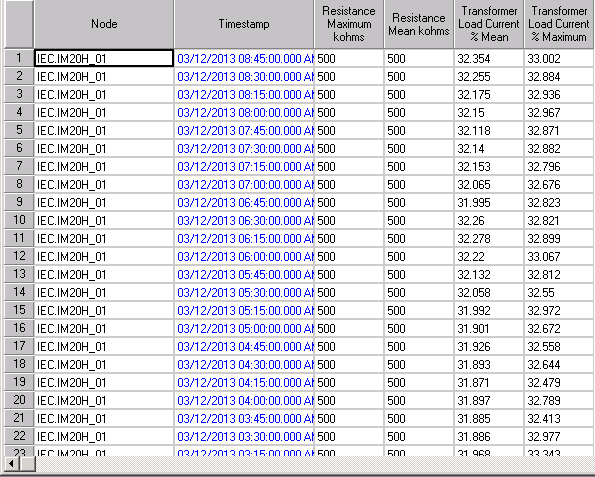
The following figure shows the historical log table from the Vista client view:

Event Log
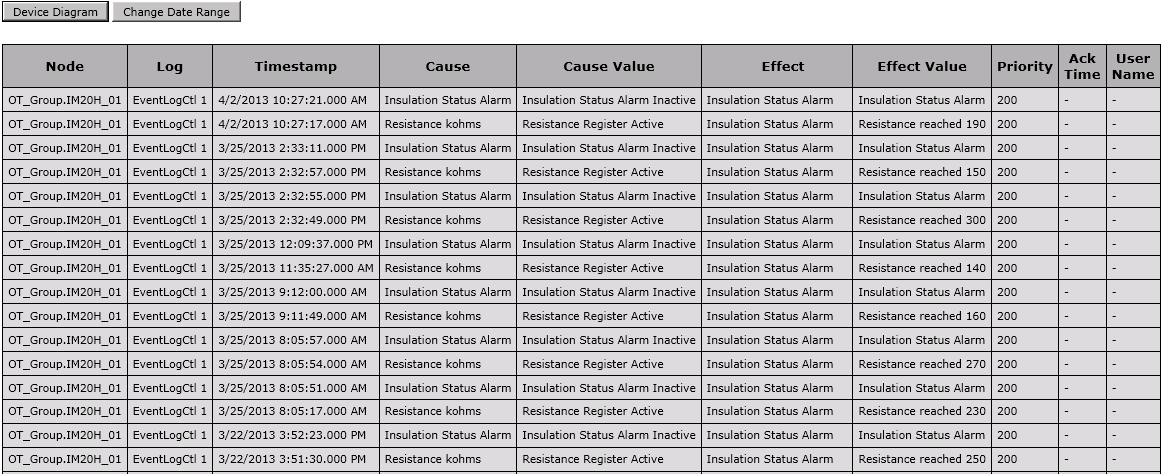
The following figure shows the event log table from the Power Monitoring Expert view:

The buttons located at the top of the table are:
- Device Diagram – Click this to return to the diagram.
- Change Date Range – Click this to view data for different dates. See "Select Date Range" below for more information.
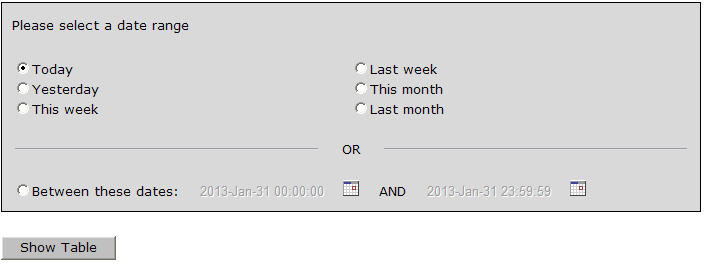
Select date range:
For either type of log table, you can select the date range for data you want to see. The default date range is "Today".
- Click Select Date Range.

- Select an available range or click Between these dates and select specific dates in the calendar.
- Click Show Table to see the data.
If you select a date range of more than one week, a message appears to inform you that the table will be very long.
The new table appears.
See the following topics:
- Using the diagrams
- Data logs
Different diagrams are provided for ANSI and IEC applications:
Related topics:
- The Diagrams user interface
- User authentication
- Viewing historical (trend) data
- Viewing meter events
- Stale data and error indicators
- Power Quality Performance diagrams
- Insulation Monitoring diagrams
- UPS Auto Test diagrams
- EPSS diagrams
- Breaker Aging diagrams
For information on how to configure Diagrams, see Diagrams and graphics configuration.