The insulation monitoring diagrams display overview or detail information as well as status.
Facility Summary diagram
The Facility Summary diagram shows each group that contains a number of areas.
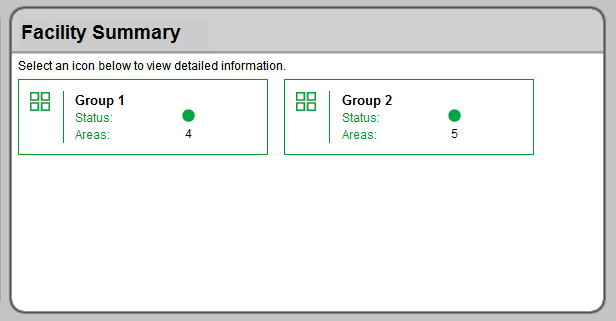
The Facilities Summary diagram shows all the groups of areas that were configured for the facility. Each box in the main area represents a group of areas. This diagram provides a status overview and links to areas in the facility, as shown next:

|
A |
Group Icon – Click the group icon to see the area diagram. |
|
B |
Status Indicator – This indicator is green or red to show the general status of the isolated power system:
|
|
C |
Areas – Total number of monitored areas in this facility. |
Recommended Actions for Alarm Condition Indication
- Click the Group icon to open the Areas diagram. One or more area boxes will show an alarm condition. .
- Click the specific area icons to open the Area Details diagrams. One or more panel boxes will show an alarm condition. If the optional circuit fault locator devices are installed, the panel box also indicates each circuit that has a resistance fault.
- Notify the responsible person that can address the condition for the area and specific circuits.
Summary of Areas diagram
The Summary of Areas diagram shows an overview of each area in the facility. Each box represents a single area.
Example:
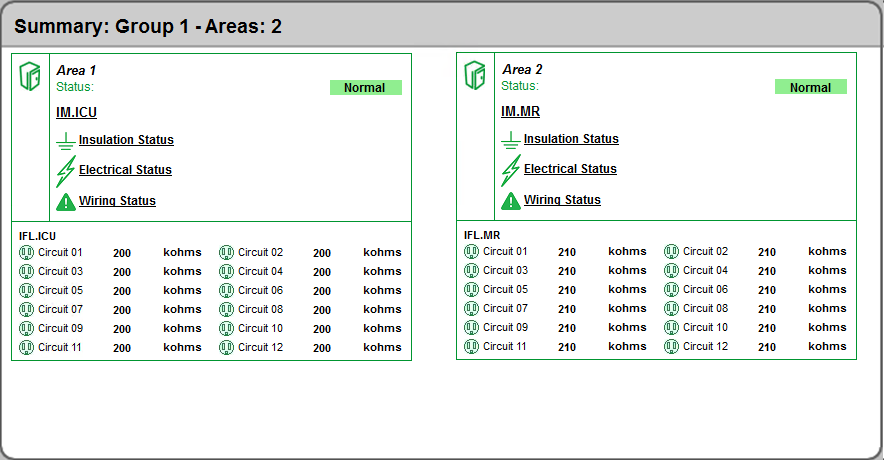
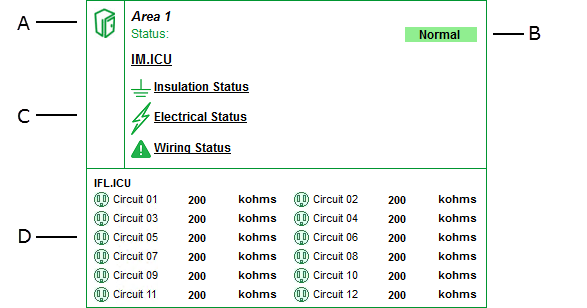
Each box represents a single area and contains the following information:
|
A |
Area Icon – Click the area icon to see the details for the insulation monitoring device measurements for this area. |
|
B |
Area Status Indicator – Indicates the general conditions of the area. This indicator is either green "Normal" or red "Alarm". If the indicator is red, the insulation resistance measurement from the insulation monitoring device is below the limit. |
|
C |
Area Information and Status Indicators – Displays the area name, the insulation monitoring device, and the status indicators. If an alarm occurs in the room, these indicators show the specific type of alarm.
|
| D |
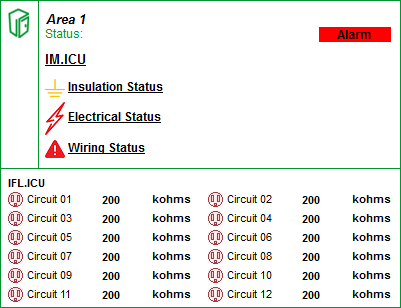
Circuit Status – Appears only if the optional Insulation Fault Locator (IFL) device is installed. This area shows the status for each circuit being monitored. If the IFL detects a resistance fault, the circuit monitor identifies the specific circuit and the circuit indicator turns red. When any indicator turns red, the alarm status propagates up to the top-level Facility Summary diagram.
|
Status indicators in an alarm condition:
Area Details diagram
The Area Details diagram shows the details for the insulation monitoring and fault locator devices.
Example:
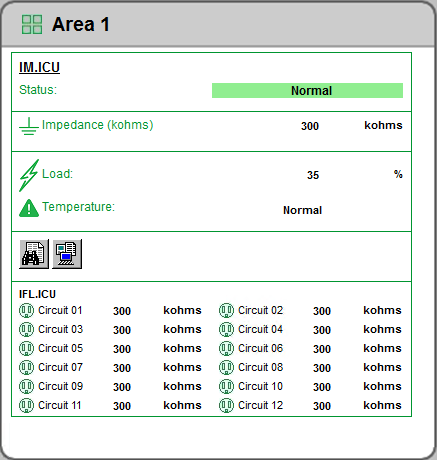
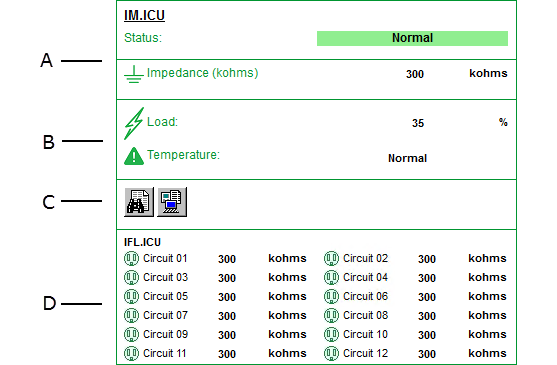
The diagram shows the following details:
|
A |
Device Name – The group and name of the device in the area. Insulation Monitoring Device Status – Green = Normal, Red = Alarm. Impedance – The real-time measurement of the impedance to ground, in kiloohms. If the impedance is lower than the threshold, the indicator turns orange. The impedance limit is set on the insulation monitoring device. |
|
B |
Transformer Indicators – The load and temperature status for the current transfer
|
|
C |
Event Log and Data Log – Contains links to the historical data log and event log for the panel measurements. See Data logs for more information. |
| D | Circuit Status – Appears only if the optional Insulation Fault Locator (IFL) device is installed. This shows the status for each circuit being monitored. If the IFL detects a resistance fault, the circuit monitor identifies the specific circuit and the circuit indicator turns red. When any indicator turns red, the alarm status propagates up to the top-level Facility Summary diagram. |
Example of status indicators in an alarm condition:
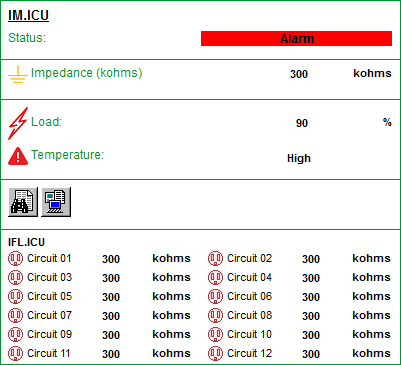
See the following topics:
- Using the diagrams
- Data logs
Different diagrams are provided for ANSI and IEC applications:
Related topics:
- The Diagrams user interface
- User authentication
- Viewing historical (trend) data
- Viewing meter events
- Stale data and error indicators
- Power Quality Performance diagrams
- Insulation Monitoring diagrams
- UPS Auto Test diagrams
- EPSS diagrams
- Breaker Aging diagrams
For information on how to configure Diagrams, see Diagrams and graphics configuration.
