Waveform analytics
Use waveform analytics to help determine the cause of power quality events within an electrical system. In Alarms, you can access waveform analytics from All Alarms, Recent Events, Recent Alarms, Recent Incidents, and Active Alarms within the alarm viewer.
Waveform analytics will:
-
Provide event characteristics.
-
Provide indications as to the cause of the event.
-
Provide whether an event is upstream or downstream.
Viewing Waveform Analytics
- In the alarm viewer, open an existing Incident history view or alarm history view from the View Library or add a new view.
- Find the incident or alarm for which you want to view waveform analytics, and click Details
 . You can also open Details by double-clicking the incident or alarm instance.
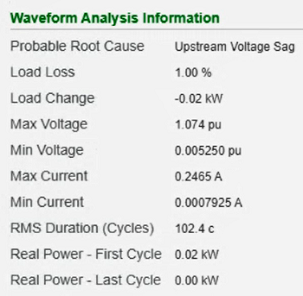
Waveform Analysis Information will be visible on the Details tab.
The Waveform Analysis Information section will provide data and information to help determine the cause of the event. Events may be caused by:
- Upstream Voltage Sag: This is an RMS event recorded when the source of a voltage sag is upstream of the monitoring location. The upstream voltage sag could be due to a fault, load start, transformer inrush, etc., and cause downstream loads to be impacted. One clue that the cause of a voltage sag is upstream from a monitoring location is that the downstream load current increases after the voltage sag ends. The temporary increase could be due to the downstream load recovering from the voltage sag.
- Downstream Load Start: This is an RMS event recorded as a voltage sag caused by the energizing of a downstream electrical load. For example, during electric motor start-up, measured current may be four times or more compared to the current measured under full load. This increased current results in a drop in voltage for a duration of milliseconds to seconds.
- Downstream Fault: This voltage sag is due to a downstream electrical fault in which one or more conductors make inadvertent contact with the ground. This may be caused by damage to an electrical conductor or due to internal damage to an electrical load. The duration of a fault is dependent upon the magnitude of the fault current. Larger fault currents typically trip a breaker or fuse more quickly. Additionally, the user interface will indicate whether the downstream fault is a single-phase fault, subcycle fault, three-phase fault, or two-phase fault.
- Downstream Inrush Event: PME can detect a downstream inrush event, which can be caused by a downstream power transformer being energized. The characteristic signature of inrush current is produced by saturation of the magnetic core of a transformer.
- Capacitor Switch Event: Capacitor switch is to maintain desired system voltage levels as reactive loads are connected and disconnected to the utility system. This event causes several impacts at distribution network like low frequency decaying, voltage and current distortion, resonance, inrush current and voltage transient.

When the waveform does not include needed data, notifications will display under Waveform Analysis Information.

When the waveform analysis is not performed, following information is provided:

Possible issues preventing successful automatic waveform analysis

 danger
equipment electric shock, explosion, or arc flash
| • | Apply appropriate personal protective equipment (PPE) and follow safe electrical work practices. See NFPA 70E in the USA, CSA Z462 or applicable local standards. |
| • | Turn off all power supplying the power meter and the equipment in which it is installed before working on it. |
| • | Always use a properly rated voltage sensing device to confirm that all power is off. |
| • | Replace all devices, doors and covers before turning on power to this equipment. |
Failure to follow these instructions will result in death or serious injury.
| Issue and description | Solution |
|---|---|
|
Waveform Analytics is not returning readings |
Check configuration and the connections of your meter to ensure it is capturing nominal voltage at the beginning of an event. |
|
Missing Voltage Phases One or more of the three voltage phases was not recorded or is missing. |
Verify that the monitoring source is programmed to capture voltages on all three channels or that all three phases have been downloaded from the monitoring source. |
|
Low RMS Voltage One or more of the three voltage phases has an RMS value for its first cycle that is less than 100 volts. |
Verify that the monitoring source is measuring a valid voltage signal on all three phases. |
|
Low Positive-Sequence Voltage One or more of the three voltage phases has a positive-sequence voltage that is less than 100 volts. |
Verify that the monitoring source is measuring a valid voltage signal on all three phases. |
|
High Negative-Sequence Imbalance The ratio of negative-sequence voltage to positive-sequence voltage for the first cycle is too high. |
Verify the connections of the meter to see if phases need to be swapped. |
|
High Zero-Sequence Imbalance The ratio of zero-sequence voltage to positive-sequence voltage for the first cycle is too high. |
Verify that all three voltage channels are connected and measuring a valid voltage signal. |
|
High Voltage THD The voltage total harmonic distortion for the first cycle of one or more of the phases is too high. |
The first cycle of one or more waveforms is too non-sinusoidal. Verify that the monitoring source is measuring a valid voltage signal. |
Related topics:
- Viewing incidents
- Viewing alarms
- Viewing events
- Viewing Disturbance Direction
- Viewing Load Impact
- Viewing a timeline analysis
- Viewing Voltage Tolerance
- Viewing waveforms
- Acknowledging alarms
For reference information see:
- Alarm Operation
- Incidents
- Alarms
- Events
- Disturbance Direction
- Load Impact
- Timeline analysis
- Voltage Tolerance
- Waveforms
- Waveform Analytics
- Alarms terminology
- Alarms UI
- Timeline analysis UI
- Waveforms UI
For information on how to configure Alarms, see Alarms configuration.